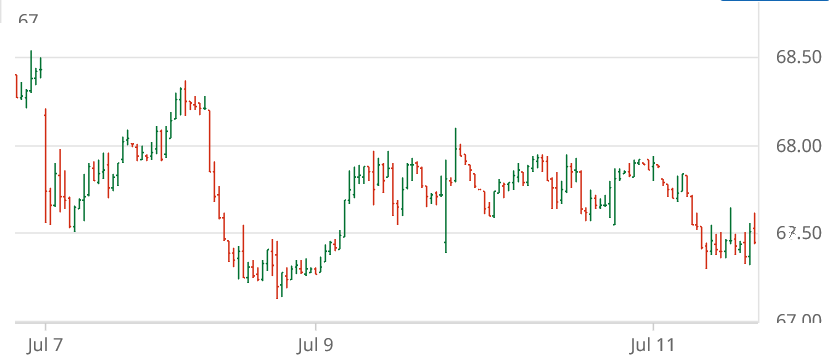
The week ending Friday, July 11 saw ICE cotton futures narrow from a wide sideways gyration to a narrow one (see chart above courtesy of Barchart.com). Chinese cotton prices were mixed, while the A-Index was flat-to-higher.
Across the week ending July 10, CBOT corn and soybean futures took a gentle glide into a long, flat landing, while KC wheat futures dropped into and bounced out of its sideways pattern. Keeping with the airline analogy ICE WTI crude oil futures followed an opposite pattern, climbing early, then trading sideways, and finally declining. The U.S. dollar index trended higher across the week. Other macro influences (i.e., GDP, inflation, and interest rate policy) remained mixed in their expectation and implication for slow economic growth.
Cotton-focused market influences this week included modestly bearish but not unexpected USDA supply/demand adjustments in the July WASDE report. The week saw continued weekly reports of very light to moderate regional demand for U.S. cotton. There were continued weak old crop U.S. export net sales for the week ending July 3, although this may be more of a function of reported light supplies. However, weekly net sales for the next marketing year were also low at 81,500 bales of upland, which has clearer implications for weak demand. The pace of 2024/25 export shipments continued above the weekly average level needed to reach USDA’s target level of exports (11.5 million bales). All of the projected U.S. old crop production has been ginned and classed since about April. New crop influences included continued rains over the central and eastern Cotton Belt, some of which spawned the deadly flash flooding in Central Texas. The precocious Indian monsoon has brought above average rains to the point that some question whether it is a net benefit or detriment to their agriculture.
For the week ending Thursday, June 26, the day-to-day shifts in ICE cotton open interest steadily increased. But the pattern of futures settlements was mixed, and therefore the implications are unclear. For what it’s worth, the regular weekly (Tuesday, June 24) snapshot of speculative open interest did show 695 fewer hedge fund short positions. But that was overshadowed by 3,856 additional hedge fund longs, week over week. Moreover, the index trader net long position expanded by 662 contracts, week over week.
ICE cotton daily trading volumes steadily declined across the week ending June 26, perhaps reflecting cautionary positioning going into the weekend prior to Monday’s milestone acreage report by USDA.
The dynamics of ICE cotton futures may also represent a wet blanket on the market. It remains true that unfixed call sales (by mills) are at an historically low level, perhaps reflecting the cautionary buying on the demand side. In terms of ratios, unfixed call purchases (by suppliers) outweigh unfixed call sales by just under two-fold across all contracts, as of June 20.
For more details and data on Old Crop and New Crop fundamentals, plus other near term influences, follow these links (or the drop-down menus above) to those sub-pages.