Longer run price outcomes for the 2025 crop depend on expectations of supply and demand. The first supply-related question is how much acreage will be planted. The price of competing crops, relative to cotton prices, is an important consideration to the level of planted acreage. The chart below shows a fairly strong relationship between the level of U.S. upland and pima cotton planted (as measured on June 30) and the ratio of December CBOT corn futures and ICE cotton futures during the first quarter of the year. The higher the ratio, the less cotton is planted. Of course, there are other important competing crops as well: sorghum, soybeans, peanuts, and perhaps wheat. And there are other non-price influences, including how dry it is in Texas, the insurance base price, fixed cost influences, and the psychological influence of the preceding growing season. But the price ratio of corn to cotton appears to capture a lot of these other influences in explaining variations in cotton plantings.
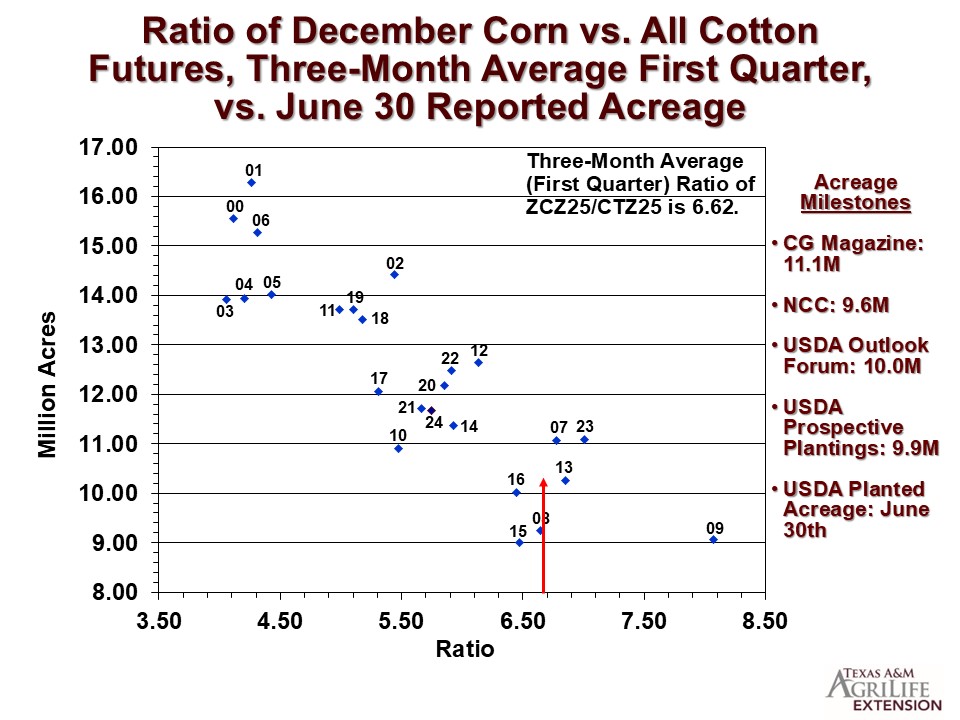
What does the above chart imply for 2025? Crop prices are during the first quarter of 2025 showed an average Dec’25 CBOT corn/Dec’25 ICE cotton ratio of 6.6. This is historically associated with between 10.0 and 10.5 million acres of all cotton.
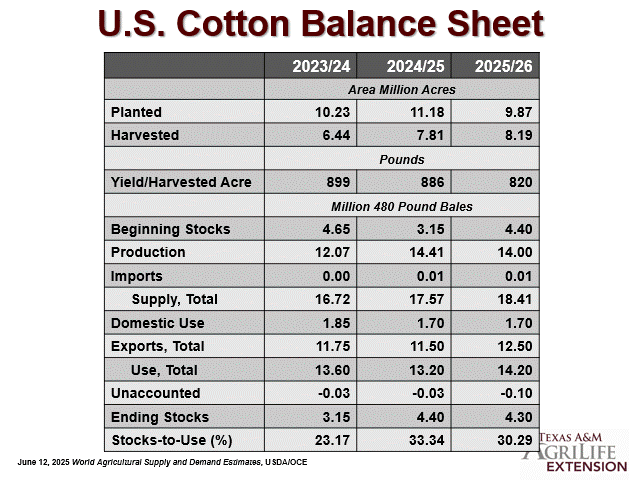
The other way of forecasting planted acreage is via surveys. The most current estimate of planted acreage (USDA Acreage) as of June 30) is 10.12 million acres, up from 9.87 million acres in the March 31 Prospective Plantings. The historical error around USDA’s June 30 Acreage estimate, ie., the difference between it and the final estimate) is 383,000 acres. So there is certainly room for adjustment.
The next step is incorporating acreage forecasts into more comprehensive balance sheet of supply and demand numbers. These are published monthly by USDA in their WASDE report. USDA’s June WASDE report included extremely bullish supply side adjustments to the U.S. new crop balance sheet, compared to the previous month’s numbers. While still working off the March 31 acreage number (9.87 million acres) the June abandonment and yield assumptions were adjusted higher and lower, respectively, on the assumption of prevented planting and yield loss to a wet Delta crop. This translated into a 500,000 bale cut in U.S. all cotton production, on top of the 400,000 bale reduction in carry-in. Hence ending stocks declined from 5.2 million to 4.3 million bales. This is very bullish in the adjustment and the resulting lower level. Now the year-over-year pattern of ending stocks is stable-to-decreasing, which has an historically bullish interpretation.
However, updating the planted acreage number to June 30’s 10.12 million acres, the balance sheet ending stocks rises from 4.4 million bales to 4.66. While still a neutral level, the upward adjustment was unexpected and likely disappointing. This takes the edge off the possibility of an early July short covering rally.
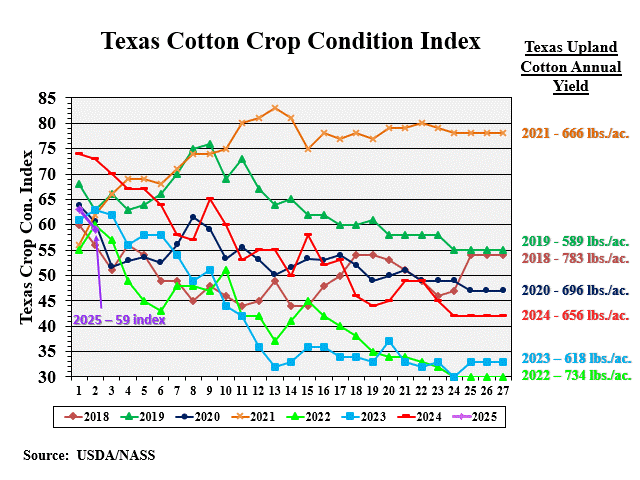
The pace of U.S. cotton planting is at 95% of intended acreage being planted as of June 29, 2025. This is 3% off of the five year average pace. Mississippi and Tennessee are the lagging outliers at 9% and 8%, respectively, off the five year average pace. Cotton squaring is at 40% nationally, which is three points ahead of the five year average pace. As of June 22, the condition rating for the 2025 Texas crop showed an index value back up to 61 — middle of the pack of historical ratings for this time of year (see chart below). The U.S. cotton condition index showed 51% “Good/Excellent” with another 32% “Fair” for the week ending June 29.
Global new crop cotton supply and demand of cotton has similar influences as those in the U.S. For example, USDA’s May WASDE reported projected a similar level of new crop ending stocks as the prior marketing year. However, new crop production, among other variables, could be higher than currently projected, especially if India and Pakistan have above average monsoon rains.