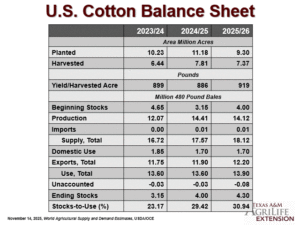
Fundamental analysis involves comparing major supply and demand variables like production, consumption, and ending stocks. This is usually based on organized tables, the prime example of which are published by USDA, and reproduced below:
Updated World cotton supply/demand. USDA’s month-over-month adjustments in the November WASDE report were bearish. Supply side adjustments included 430,000 more bales of beginning stocks, mainly in Central Asia, Australia, India, and the EU, compared to September. More significantly, world production was raised by 2.4 million bales, month over month, mostly in China (+1,000,000), the U.S. (+900,000) and Brazil (+500,000). World imports were 300,000 bales greater compared to September, mostly in China (+200,000) and Vietnam (100,000). On the demand side, world exports was also raised 300,000 bales compared to September, mostly in Brazil (+200,000) and the U.S. (+200,000). World consumption was basically unchanged with only a 50,000 bale increase compared to September. The supply side increases therefore dominated the balance sheet adjustments, giving a bearish modest 2.79 million bale increase in world ending stocks, relative to September. Such an adjustment would normally be bearish according to theory and history.
Updated U.S. cotton supply/demand. USDA’s November WASDE adjustments were dominated by the increase on the supply side. U.S. beginning stocks were unchanged, but the increase in average yield per harvested acre resulted in the 900,000 bale increase in U.S. production. On the demand side, U.S. exports were raised 200,000 bales to account for more exportable surpluses. The bottom line of all this was a 700,000 increase in U.S. ending stocks, which is an bearish adjustment and a price neutral year over year level level.
Fundamental analysis is fairly straightforward in its application. However, there are a lot of moving parts and uncertainty in balancing supply and demand variables. The price outlook can also be influenced by non-fundamental factors, particularly in the short run.
