Discussion
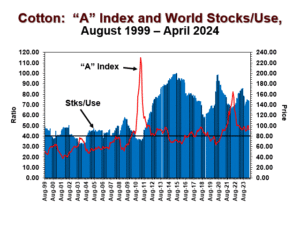
This graph shows monthly world stocks-to-use estimates (in percent) matched against the A-index of world cotton prices (in cents per lb). As usual, stocks-to-use moves in the opposite direction from world prices. An apparent key threshold is 40% world stocks-to-use (dark horizontal line) which is the point where major trends in world prices (either up or down trends) tend to change direction.
-
Howdy!
Welcome to the educational website of Dr. John Robinson in the Department of Agricultural Economics at Texas A&M University.
The website focuses on farm-level implementation of strategies for Texas cotton growers to deal with yield and price risk. Contact me to receive a weekly e-mail notice of when the latest edition is posted on-line. In addition, we provide daily crop market news and commentary on Twitter (@aggie_prof) and also on the Master Marketer facebook page. We welcome your feedback and interaction in these social media.
-
Whats New
