Policy Uncertainty. Policy changes are a common source of surprises (“shocks”) to cotton market outcomes. Recent years provide numerous case studies. Some examples include India’s domestic minimum support price program; the U.S. 2018 farm bill updated with the commodity title elements in the 2025 Budget Reconciliation bill (“One Big Beautiful Bill”); the 2026 “bridge loans”, the U.S.-China Phase One Agreement; the U.S. Market Facilitation Program; the U.S. CARES Act; U.S. trade sanctions on products from Xinjiang Province; and the periodic policy announcements of the Chinese National Development and Reform Commission, which include management of their cotton reserves, and cotton import quota announcements. The unexpected string of tariffs and counter-tariffs are the most recent example of policy shocks. The retaliatory tariffs by China on U.S. cotton should have minor impact because of the relatively small volume of U.S. cotton sold to China this year. However, the impact of the unexpected tariff announcements is increasing general uncertainty which can have a wet blanket effect on the cotton futures market.
Supply Uncertainty
On the supply side, the cotton market is zeroing in on the level of production. The January WASDE trimmed 300,000 bales of (mostly Delta) cotton, which is within the historical percent deviations between now and the end of the marketing year (see below). Not surprisingly, the February WASDE showed no change on the production/supply side. Minor refinement is historically reflected by the narrowing of the percent monthly deviations of the first (August) to later (February) monthly forecast (see Figure 1 below).
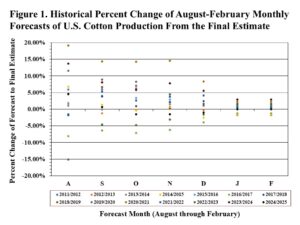
USDA’s January and February production forecast of 13.92 million bales of U.S. all cotton zeroing in on the final number. The relevant information flow includes updated forecasted ginnings, and a count of bales classed. The most recent ginning forecast (as of March 1, published March 10) reflects 13,483,450 running bales (or 13,854,919 statistical bales) ginned, which is 99.5% of NASS’s current production forecast of 13.92 million bales of U.S. all cotton. The 2025 crop classing reports (latest for week ending March 26) reflects 13,467,765 running bales (or 13,832,802 statistical bales), which is 99.4% of NASS’s current production forecast of 13.92 million bales of U.S. all cotton.
Demand Uncertainty. For U.S. cotton, the two main demand categories are domestic mill use and exports. Domestic U.S. consumption is forecasted by USDA at only 1.7 million bales. Exports are generally a more important source of demand as they represent over 80% of U.S. cotton use.
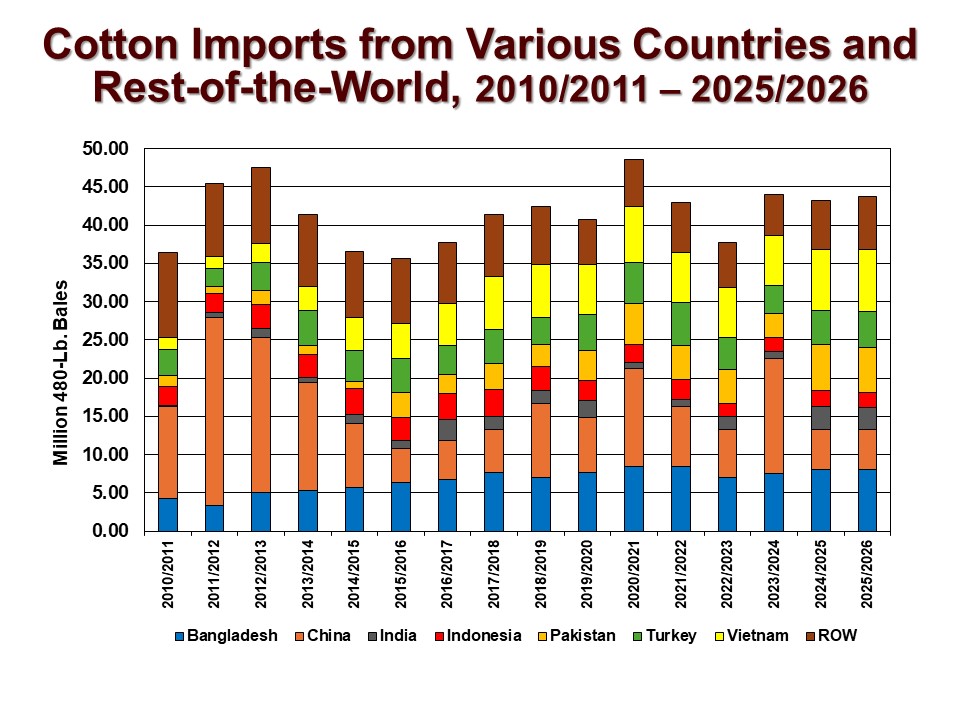
As shown below, the destination of U.S. exports has been changing. In the last three years, China’s policy-driven cotton imports has shifted from boom to bust. That leaves the U.S. competing for cotton exports to Southeast and South Asian destinations, as well as other regions of the world.

The main indicators of U.S. export demand are weekly sales and shipments of U.S. cotton. The first six months of weekly 2025/26 export sales numbers were weak to modest. Then we saw some marketing year highs in export sales during January, but this has down-shifted back to mostly modest levels in February and March. For example the week ending March 12, 2026 saw unspectacular sales at 204,500 running bales of upland and pima combined. We need to see stronger weekly levels to have evidence of improving demand. Other export indicators like weekly shipments and total commitments reflect relatively weak, or at least unspectacular, export demand.
Lastly, there is the question of longer term demand. I am cautious about the possibility of macro headwinds related to world GDP, inflation, and central bank policy. Stagflation is a possible risk that is historically associated with declining cotton demand. Short of that, just having low, slow growth in the world economy could deprive the cotton market of sustained price support, leaving only the volatile and short lived weather market influence discussed above.