Discussion
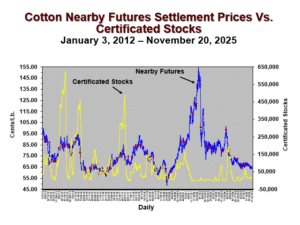
The current allocation of certified stocks, and a lot more cotton futures information, can be found on the ICE futures website under “Featured Reports”. Certified stocks represent mostly merchant inventory that is in position to be delivered against short futures positions, i.e., delivered by those holding short futures contract. The level of certificated stocks in delivery point warehouses is reported daily by the ICE. As the chart above shows, certificated stocks can fluctuate a lot. Those fluctuations can have various meanings. A declining certified stocks level can be an indicator of increasing commercial demand. Conversely, when certificated stocks are rising, it may reflect a lack of demand for U.S. cotton in the export market.
A high level of certificated stocks (e.g., over several hundred thousand bales) represents a greater credible threat of physical delivery of cotton against long futures positions held past First Notice Day. Therefore a potential side effect of low certified stocks is that it might have encourage speculative funds to take larger long positions with less chance of a getting caught in a long squeeze situation and/or getting stuck taking delivery of physical cotton. With low potentially deliverable supplies, the fund sector may feel like it has more room to push the futures market higher (and further from the cash market) provided it has enough time to eventually exit that long position.
The drop-dead date for funds holding long positions is First Notice Day (the 5th business day before the end of the previous month before contract expiration). Those dates are indicated on the chart above as red dots on the blue line. That is the day when sellers of futures contracts notify the exchange of intended deliveries of physical cotton against their short futures positions. Generally, the people in that position are big cotton merchants, who are also the people who certify most cotton.
The certified stock level level has been fluctuating a lot in recent years and in recent months, reflecting changing supply and demand of U.S. cotton. For example, during 2023 the level declined to less than 100 bales in May, only to climb to over 20,000 bales in June, and settling back just under 9,000 bales in early July and then below 500 bales in August. Then it rose by over 87,000 bales through November. Then it plunged and lingered around 1,000 bales since January 25. Then in March the level of certified stock increased steadily and dramatically, reaching 193,691 bales as of May 28. Then the level fell abruptly, fluctuated, and fell again to a low of 174 bales in early November. It bounced back over 20,000 bales by December 11, 2024, then down to under under 250 bales as of early February, and then between 14,000 and 17,000 bales over March and April, and over 43,000 by the end of May, reaching 62,332 by June 18, and then slipping back to 15,474 through September and then rising to 20,344 as of November 20. Roughly two thirds of that inventory is in the DFW delivery location.
