Discussion
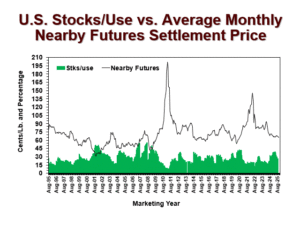
This graph shows twenty years of monthly U.S. stocks-to-use estimates (in percent) matched against nearby NY cotton futures prices (in cents per lb). Stocks-to-use generally moves in the opposite direction from prices. When considering NY cotton futures prices, there is a little more room for distorting influences, e.g., speculative buying and selling.
-
Howdy!
Welcome to the educational website of Dr. John Robinson in the Department of Agricultural Economics at Texas A&M University.
The website focuses on farm-level implementation of strategies for Texas cotton growers to deal with yield and price risk. Contact me to receive a weekly e-mail notice of when the latest edition is posted on-line. In addition, we provide daily crop market news and commentary on Twitter (@aggie_prof) and also on the Master Marketer facebook page. We welcome your feedback and interaction in these social media.
-
Whats New
