Discussion
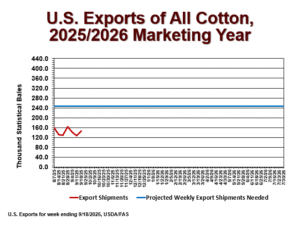
The blue line in the chart above shows actual weekly export shipments for the 2025/26 marketing year (converted from running bales into 480 lb. statistical bales, using USDA’s conversion factor of 1.03). The week ending September 18 saw export shipments below the weekly pace needed to reach USDA’s 12.0 million bale target. However, it is not unusual to see a seasonal pattern where above-average shipments are bunched up next Spring.
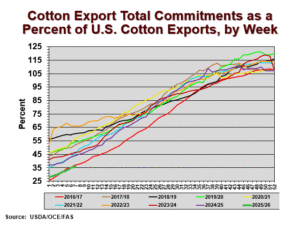
Another indicator of export demand is the percent of U.S. export total commitments to USDA’s forecast export target of 12.0 million bales. Total commitments of all cotton as of September 18, 2025 included 969,279 bales worth of accumulated exports of all cotton, i.e., pima and upland sold and actually shipped since August 1. It also includes another 3,204,162 running bales of pima and upland sold but not yet shipped (“outstanding sales”). The total of accumulated exports and outstanding sales is 4,173,441 running bales of total commitments which, after converting to statistical bales, is 36% of USDA’s 12.0 million bale target for projected 2025/26 U.S. exports. This is in the lower portion of the historical seasonal patterns of export sales as a percent of total forecasted exports (see below). This can be interpreted as an indicator of weak demand for U.S. cotton exports, which is related to the competitiveness of our main export rivals.
Lastly, the chart below shows total commitments of U.S. cotton just to China (the total height of the bar) as the sum of end-of-season accumulated exports and outstanding sales. The point of this chart is that U.S. exports to China in 25/26 (through September 18) remain historically low, as they were during the entire 2024/25 marketing year. Hence there is currently little direct impact of Chinese tariffs on U.S. cotton.


