Discussion
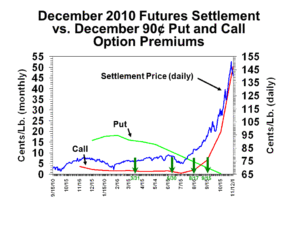
This graph shows daily settlement prices for Dec’10 futures from about fourteen months out through expiration (blue line). The green and red lines show the premium value associated with 90-cent put and call options, respectively.
2010 was an amazing year. During the first half of the year, prices generally stayed where they were forecasted in the 70s. Then the combination of floods in Pakistan, freezes in China, and a previous multi-year draw-down in world stocks led to a panic buying spree in the cash market. The latter pulled ICE futures up with it.
There were reports of speculators in August who bought $1.00 calls for a half cent. This kind of a gamble would have paid off handsomely.
Buying put options as downside price insurance was still a rational strategy, and would have also paid off assuming 1) a stable basis, and 2) the grower sold his cash cotton later in the season at high prices.
