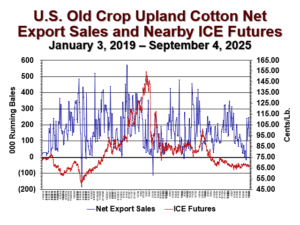
Response of U.S. Cotton Export Sales to ICE Cotton Futures Price (Scroll Down for More Discussion)

Discussion
The red line shows daily settlement of nearby ICE cotton futures, in cents per pound. The blue peaks and valleys reflect weekly net export sales, with the latest observations on the right-hand-side for the 2025/26 marketing year, in thousands of running bales. The graph generally shows the expected demand response to fluctuating futures prices for the 2025 crop. Generally, as U.S. prices weaken, export sales (“quantity demanded”) fluctuate higher. For the week ending September 4, the weekly net sales of U.S. cotton slipped to a weaker level at a 130,800 bales of upland and pima combined.