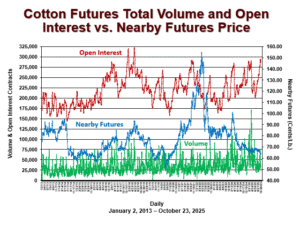
The current allocation of volume, open interest, and a lot more cotton futures information, can be found on the ICE futures website under “Featured Reports”. Volume (viewed above as the green line) is defined as the total daily number of contracts traded in a daily session. The level of volume is often used to gauge the strength of continuing or changing trends. Typical cotton daily volume bounces around between 10,000 and 25,000 contracts. Through Thursday, November 6, ICE cotton futures showed above average volumes between 57,285 contracts (on November 4) and 75,965 contracts (on November 6). The Dec’25 and Mar’26 contracts had 49% and 35% of the volume, respectively, as of November 6.
Open interest (the red line above) refers to the number of active positions at the end of the day (not double counting both the buyer and seller). Open interest by contract has a similar front month concentration as does volume, e.g., the Dec’25 and Mar’26 contracts had 42%, and 33% of the open interest, respectively, as of November 6. Open interest does not fluctuate as much as daily volume, but there are patterns where sharp surges or declines in open interest are associated with sudden rallies or sell-offs, often in high volume. Through Thursday, November 6, the shifts in ICE cotton open interest were mostly increasing compared to the previous session. This, and the mostly lower price settlements, gave the appearance of new short selling.
