Discussion
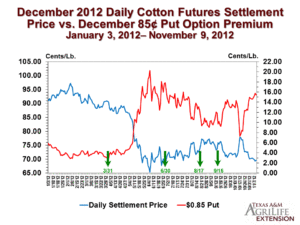
The blue line shows the settlement price of Dec’12 futures on the ICE. The scale of the futures price is on the left side of the chart, in cents per pound. The red line shows the premium associated with a $0.85 strike put option on Dec’12 futures. The scale of the options premium is on the right side of the chart, also in cents per pound. Naturally, the put option premium increases when Dec’12 futures are declining, and the put option gets cheaper when the futures price rises. But the premium has also declined from reduced time value. The major price move during 2012 was a major twenty cent decline in the futures price between the March and June acreage reports. (The source of the price decline had less to do with the level of acreage and more to do with the multi-year adjustment back to “normal” prices following the 2010-11 price spike). An 85 cent put option purchased in late March for around three cents would have been worth between ten and twenty cents later in the season. This is a good example of paying a relatively affordable insurance premium to insure a profitable price level.
-
Howdy!
Welcome to the educational website of Dr. John Robinson in the Department of Agricultural Economics at Texas A&M University.
The website focuses on farm-level implementation of strategies for Texas cotton growers to deal with yield and price risk. Contact me to receive a weekly e-mail notice of when the latest edition is posted on-line. In addition, we provide daily crop market news and commentary on Twitter (@aggie_prof) and also on the Master Marketer facebook page. We welcome your feedback and interaction in these social media.
-
Whats New
